|
TUTORIAL
Tutorial 1. Workflow: The
sidebar has a Work Flow entry which contains the detailed step-by-step description
for conducting a di/tripeptide
search by PEP Search in MyCompoundID. The user is
encouraged to read this description for an overall picture of how PEP Search
works. For the user's convenience, this description is also included here as
follows (Figure 1).
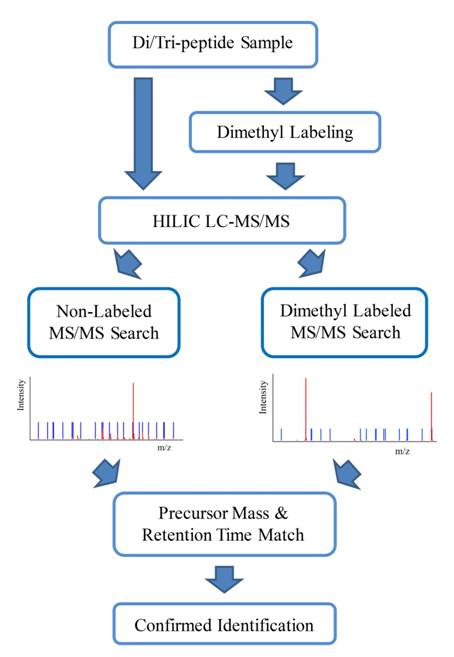
Figure 1. The workflow of PEP Search. 2. Di/tripeptide
Databases: PEP Search in MyCompoundID searches an MS/MS spectrum against a database
of di/tripeptides. This database consists of 400 dipeptides and 8000
tripeptides, and their theoretical MS/MS fragments. PEP Search also provides an
option to do dimethyl labeling confirmation. This option enables the search
against the 8400 di/tripeptide database plus a library, which consists of
dimethyl labeled 8400 di/tripeptides and their theoretical MS/MS fragments. 3. Dimethyl Confirmation: PEP
Search provides an option to confirm the identification of di/tripeptides by dimethyl
labeling. To do so, the same sample should be dimethyl labeled and analyzed
with the same LC gradient on LC-MS/MS. The generated dimethyl labeled spectra
should be searched together with the non-labeled LC-MS/MS spectra in a .csv
file. The search results provide putative di/tripeptide IDs and the matched
dimethyl labeled a1 ions. If the N-terminal amino acids of the di/tripeptide
IDs are confirmed by the dimethyl labeled a1 ions, their IDs are then
confirmed and their match scores are increased correspondingly. 4. Single Mode Search:
Besides batch mode search of LC-MS/MS spectra in .csv
files, PEP Search also provides single mode search for manually checking a
single MS/MS spectrum by directly input precursor mass, MS/MS fragments and
their intensities. The following demonstrates the flow of using
PEP Search in batch mode with input LC-MS/MS data of di/tripeptide standards. 5. Search Parameters. There are several parameters that need
to be set by the user before submitting a query.
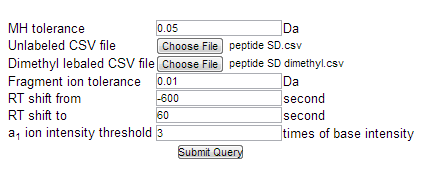
Figure 2. PEP
Search's interface showing the search parameters. a.
Mass tolerance. The
user can define a search mass error threshold in Daltons (Da). The default is 0.05 Da, which is
applicable for data generated from QTRAP or QTOF mass spectrometer. The ??MH Tol?? defines the mass tolerance of precursor ion, and ??Peak
Tol?? defines the mass tolerance of fragment ions in the
MS/MS spectrum. The user can specify a mass tolerance threshold based on the
mass accuracy obtainable from the user's instrument. Note that adjusting this
search parameter will have a significant effect on the number of hits returned
for the query spectrum. Please refer to Figure 3.
Figure 3. The mass
tolerance thresholds can be entered in Da. b.
Retention time shift window. For dimethyl labeling confirmation in the search, the
retention time (RT) shift window for dimethyl labeled di/tripeptides can be
adjusted according to users?? LC gradients in seconds. The RT shift window can
help matching non-labeled and dimethyl labeled peptides based on their
precursor mass and retention time. From our experience with HILIC separation of
di/tripeptide standards, dimethyl
labeled di/tripeptides usually elute earilier than non-labeled peptides. The
default RT shift window is set to from -600 sec to +120 sec. Please
refer to Figure 4.
Figure 4. The retention
time (RT) shift window can be entered in sec. c. a1
ion intensity threshold. After dimethyl labeling, the intensity of a1 ion will be
greatly enhanced. To differentiate dimethyl labeled a1 ions from
other fragment peaks, a ion intensity threshold can be adjusted. In default
setting, the intensity threshold is set to be 5 times of base intensity, which
is the background intensity. Please refer to Figure 5.
Figure 5. The a1
ion intensity threshold can be entered. 6. Submitting a query. Once all parameters have been set, the user can click on:
7.
Search result
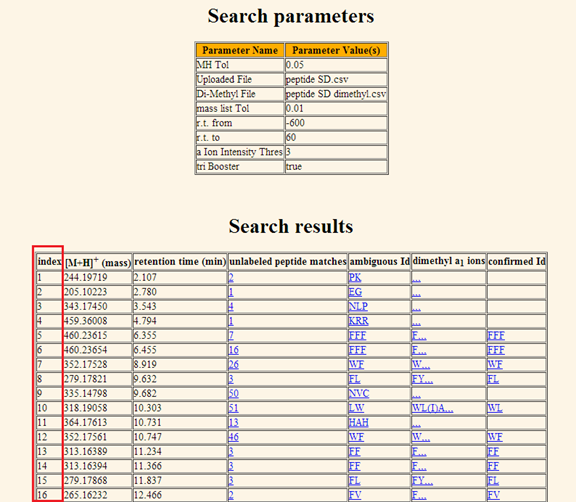
display. The
result page displays two tables, the parameter table and the search result
table. The parameter table is displayed at the top of the page in order to
remind the user of the parameters selected for that particular search query.
The result table is displayed immediately below. Note that the entries in the
result table can be sorted by their retention time. The result table consists of the following columns: a. Number of matched entries. The first column indexes the hits returned for the
search query.
Figure 7. The search
result page displaying both the parameter table and the result table. The first column indexes the matched entries for
the query. b.
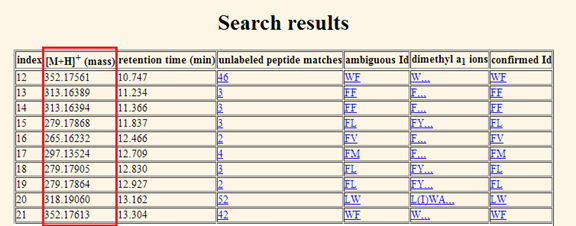
[M+H]+ (mass). The second column shows the monoisotopic
molecular mass of the peptide in Da (Figure 8).
Figure 8. The masses in Da of the matched entries are
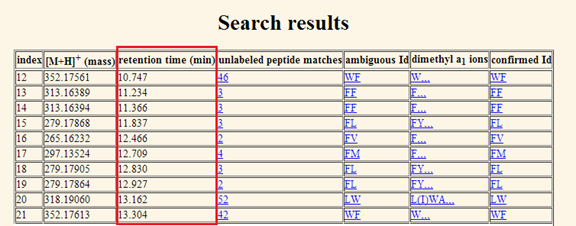
displayed in the second column. c. Retention time (min). The third column shows the retention time of the peptide in minute
(Figure 9).
Figure 9. The retention time in minute of the matched entries are
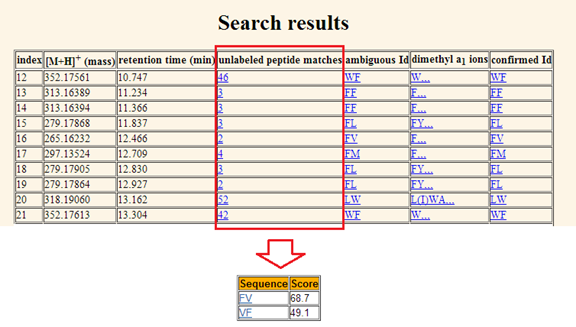
displayed in the third column. d. Unlabeled peptide matches.
The forth column displays peptide
identifications for the matched entry. The number indicates how many peptide
identifications are matched with one entry. By clicking the number in this
column, a table containing all identifications for that entry and their scores
will be displayed as shown in Figure 10.
Figure 10. The numbers of peptide
IDs for queries shown in the forth column. Each number is linked to an
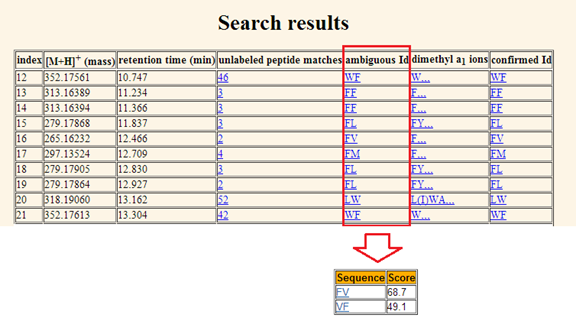
identification table of match scores. e. Ambiguous Id: The
ambiguous Id shows the first ranked identification entry in the unlabeled
peptide matches. By clicking the ambiguous Id, the same identification table as
shown in Figure 10 with peptide identification sequence and score will be
displayed. Please refer to Figure 11.
Figure 11. The first ranked ambiguous peptide Id for
queries was shown in the fifth column. Each Id is linked to an identification
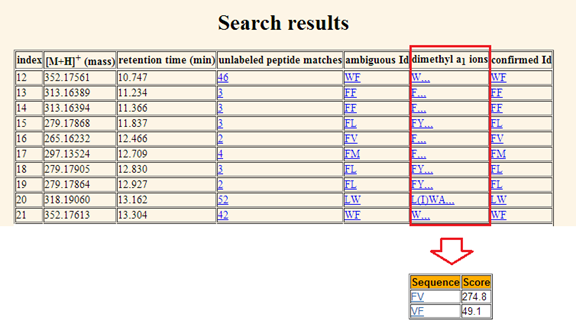
table of match scores. f.
Dimethyl
a1 ions. The dimethyl labeled a1
ion matches for one particular precursor mass and retention time window are
displayed in the fifth column. Commas separate the possible number of lysine
(K) in peptide sequence. If there is no K in the peptide, its matched dimethyl
a1 ions are displayed in front of the first comma; if there is one K in the peptide,
its matched dimethyl a1 ions are displayed between the first and the
second comma;?? In total, there are at most three K??s in a tripeptide; in this
case, the matched a1 ions in dimethyl confirmation will be shown
after the third comma. The dimethyl labeled a1 ion match also is
linked to a table containing peptide identifications and their match scores
after dimethyl confirmation. If there is an a1 ion matched in
dimethyl confirmation, the score for that peptide will be increased. Please
refer to Figure 12.
Figure 12. The
dimethyl a1 ions matched for the query shown in the sixth column. It is linked
to an identification table containing peptide identifications and their match scores
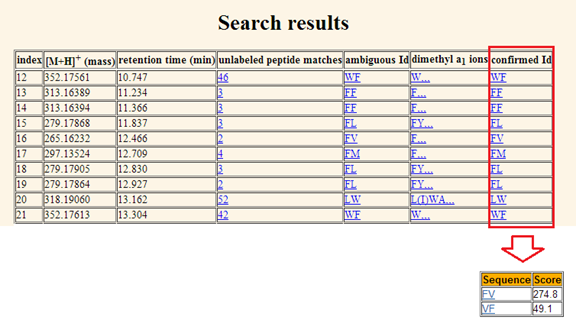
after dimethyl confirmation. g. Confirmed Id: The
confirmed Id in the search result table displays the first ranked confirmed
peptide identification by matching the ambiguous Id and the dimethyl a1
ions. By clicking the entries in this column, a table containing peptide
identifications and their match scores after dimethyl confirmation. Please
refer to Figure 13.
Figure 13. The
confirmed Id displays the first ranked identification of peptide after matching
the ambiguous Id and the dimethyl a1 ions. It is linked to an
identification table containing peptide identifications and their match scores
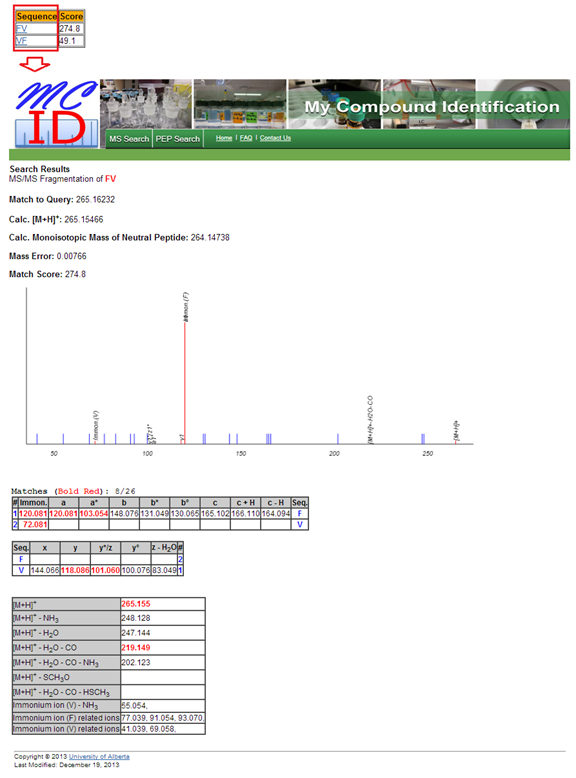
after dimethyl confirmation. h. Matched spectrum. By
clicking the peptide identification in identification table, under the column
of ??Sequence??, a webpage interpreting the MS/MS spectrum of that identification
will pop out. As shown in Figure 14, this webpage contains a MS/MS spectrum (red)
match with its theoretical spectrum (blue), and tables listing all MS/MS
fragments of that peptide and its hits.
Figure 14. An
MS/MS spectrum interpretation webpage for a peptide
identification. |