|
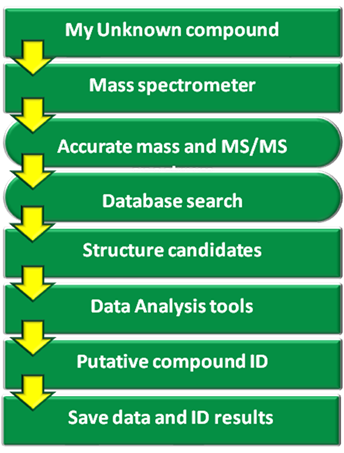
TUTORIAL 1. Work Flow. There is a link entitled Work Flow on the left-hand side panel of the homepage. This work flow describes the steps required to do a metabolite search using MyCompoundID. The user is encouraged to take a look at this work flow to obtain an overall picture of how MyCompoundID works. For the user's convenience, a copy of it has been included in this tutorial. Please refer to Figure 1.
2. Human Metabolome Database. MyCompoundID searches against a library of human endogenous metabolites found on the HMDB (Human Metabolome Database, URL: http://www.hmdb.ca/). This library consists of 8,021 entries, about 900 of which have MS/MS spectra acquired on a triple quadrupole instrument at three different collision energies. All this information is accessible by clicking on the HMDB links on the query results table. 3. Mass list of unknown metabolites. The user will require a mass list obtained from the sample of interest analyzed by MS or LC-MS. Mass accuracy plays an important role in narrowing down the number of possible candidates. It is therefore recommended that the mass list used has an error no greater than 5 ppm. Please refer to section 4-d.
The following describes how to use MyCompoundID using hydroxyoctanoylcarnitine as an example. 4. Search parameters. There are a number of parameters that need to be set by the user before submitting a query.
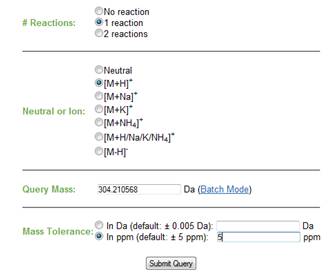
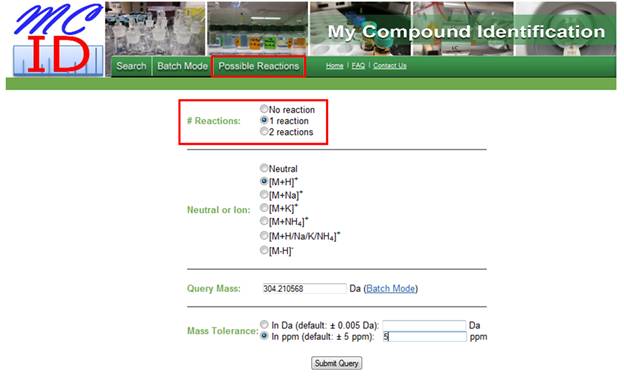
a. Number of reactions. MyCompoundID has a total of 76 possible metabolic reactions that are known to take place in metabolism. These include Phase I (e.g., hydroxylation) and Phase II (e.g., glucoronidation). A complete list of these reactions can be found in the tab labelled "Possible Reactions" found at the top of the screen (Figure 3). i. If the user wants to search against endogenous metabolites found in the HMDB, "No reaction" can be selected. ii. "One reaction" can be selected to search for compounds that have undergone one metabolic reaction, whether it is a Phase I or Phase II reaction. iii. "Two reactions" can be selected to search for compounds that have undergone any two metabolic reactions, whether they are both Phase I or Phase II or one of each.
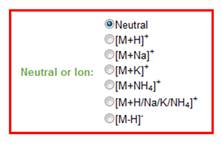
b. Neutral species or type of ion. The user has the option to search for neutral molecules, [M+H]+ ions, [M-H]- ions and the most common adducts obtained by the ionization process, such as sodium and ammonium adducts. Alternatively, the user can do a search that includes all options. Please refer to Figure 4.
c. Mass. The user can enter a single mass to search against the database or can choose to enter a list of masses (batch mode). Please refer to Figure 5. i. Batch mode. In batch mode the user can enter a list of masses, separated by one or more spaces or by a comma. Upon submitting a query, MyCompoundID will display a list that includes the masses entered, the ion type and the number of matched entries per compound. The user can then click on the number of hits to display all possible candidates for that particular mass.
d. Mass tolerance. The user can select a search mass error threshold in either parts Daltons (Da) or per million (ppm). The default is 0.005 Da or 5 ppm, which is the typical mass accuracy readily achievable by high resolution instruments, such as an FT (Fourier Transform) or a TOF (Time-of-Flight) mass spectrometer. The user can specify a mass tolerance threshold based on the mass accuracy obtainable from the user's instrument. Note that adjusting this search parameter will have a significant effect on the number of hits on the query. Please refer to Figure 6.
5. Submitting a query. Once all parameters have been set, the user can click on:
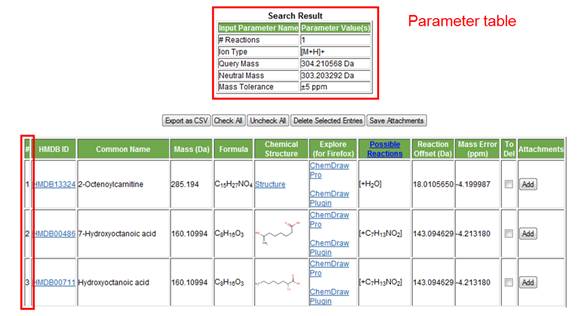
6. Search results display. The results page displays two tables, the parameter table and the results table. The parameter table is displayed at the top of the page in order to remind the user of the parameters selected for that particular search query. The results table is displayed immediately below. Note that the entries in the results table can be re-arranged by any column value, such as increasing or decrease mass, mass error, or reaction offset, by simply clicking on the heading of the desired column. The user also has the option of selecting and deleting particular matched entries as well as saving both tables as a .csv file that can be opened using Microsoft Excel.
The results table consists of the following columns:
a. Number of matched entries. The first column on the left is simply used to number the hits observed by a particular search query.
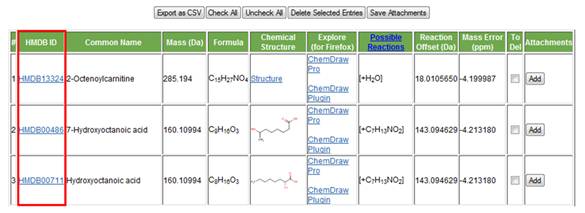
b. HMDB link. The second column on the left (Figure 8) is a link to the HMDB. Clicking on it will open the compound's "MetaboCard". This "MetaboCard" contains a large amount of information on the metabolite of interest, including biological relevance, synonyms, chemical structure, physical properties and, in some cases, experimental 1H and 13C NMR as well as MS/MS information.
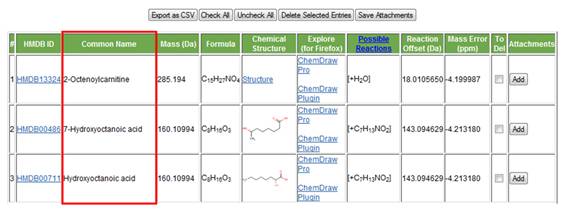
c. Common name. The metabolite's commonly used name is displayed in the third column (Figure 9).
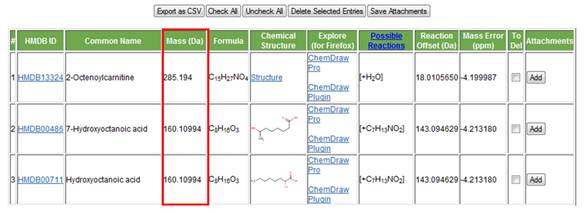
d. Mass (Da). The fourth column from the left shows the monoisotopic molecular mass of the compound (Figure 10).
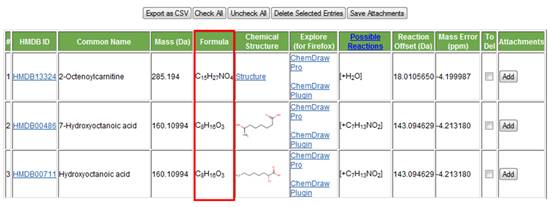
e. Chemical formula. The chemical formula of the compound found from the HMDB is displayed in the fifth column (Figure 11).
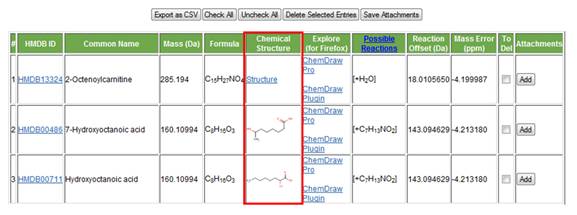
f. Chemical structure. The chemical structure of the compound is displayed in the sixth column.
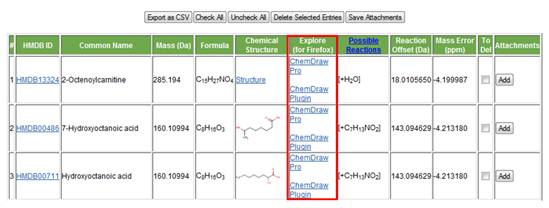
g. Link to ChemDraw Pro or Plug-in. The user who already owns a copy of ChemDraw software (http://www.cambridgesoft.com/software/ChemDraw/)can simply click on the link to open the structure of the metabolite of interest. For other users there is also the option of using the free-ware ChemDraw Plug-in (with Firefox only; it will not work with Internet Explorer). Users can manually compare their experimental MS/MS spectrum to the fragments formed using ChemDraw's fragmentation tool (see below).
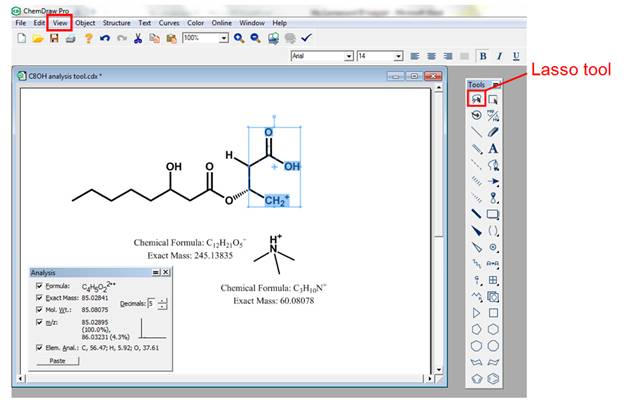
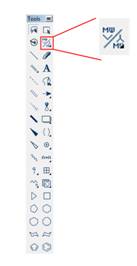
· Fragmentation tools. A useful feature of this piece of software is its fragmentation tools which are within its main toolbar (see Figure 14) or can be found under other toolbars in the View menu. Note that the user is required to add or remove a proton (in the case of a positive or negative ion search, respectively) before breaking any bonds in the molecule. In the case of an adduct ion search, the user is also required to add the adduct counter ion to the displayed molecule.
· Bond cleavage. After clicking on the mass fragmentation tool icon, the user can draw a line across the bond to be broken. The software will automatically calculate the exact mass of each fragment which can be compared to the experimental MS/MS spectrum. Please refer to Figure 15. Note that the software can only do homolytic cleavage of bonds; as a result, radical species are formed. It is up to the user's discretion to assign charges to the produced fragments. Note that the exact mass of all structures can be displayed by selecting the molecule of interest with the lasso tool, right clicking on it and selecting exact mass under the Analysis option. 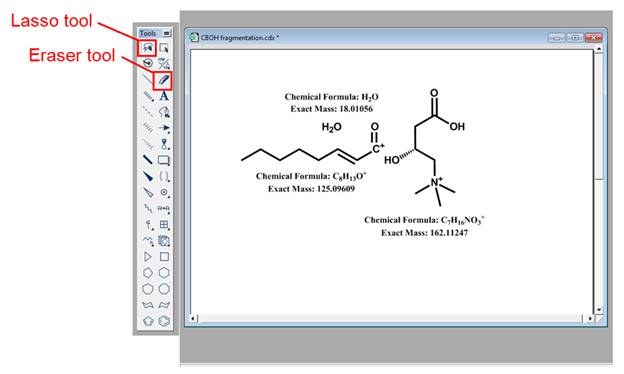
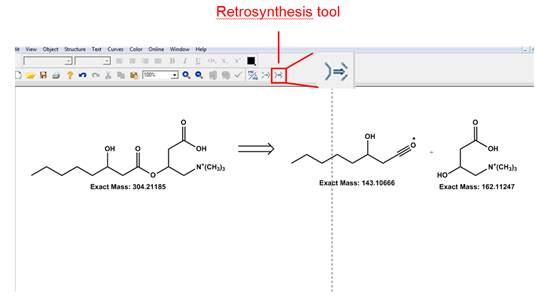
· Retrosynthesis tool. Another useful component of the fragmentation capabilities of the ChemDraw software is the retrosynthesis tool. After clicking on it, the user can draw a line across the bond to be broken and the software will automatically draw the products of the "retrosynthesis" reaction. As with the bond cleavage option, it is up to the user to account for charges and hydrogen atoms. Please refer to Figure 16 to see an example of how this tool works.
· Rearrangements. Although the fragmentation tool is not capable of carrying out rearrangements, such as McLafferty rearrangement, the user has the option of using the lasso tool to select a portion of the molecule that could correspond to a particular rearrangement and shift hydrogens as necessary. The lasso tool is found on the top left hand corner of the tool bar. Once a portion of the molecule has been selected, the user can then go to the view menu and select "Show Analysis Window". A window will pop up containing the exact mass of the selected portion of the molecule. Please refer to Figure 17.
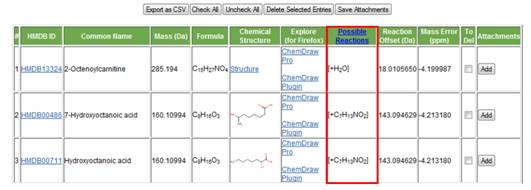
h. Possible reactions. This column (Figure 18) shows the group that has been added or removed from the corresponding metabolite (as a result of a metabolic reaction) to obtain the mass that was searched for.
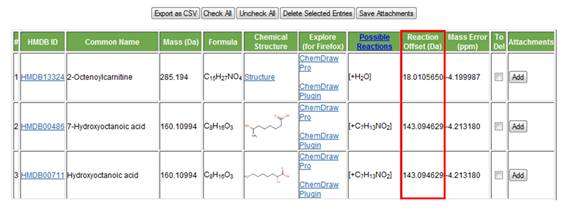
i. Reaction offset. The mass of the group that was either added or removed as a result of a metabolic reaction is displayed in the ninth column (Figure 19).
j. Mass error. The difference in mass between the query mass and the mass of the matched entry is displayed (Figure 20). If the mass tolerance was set in Da the error will be displayed in Da. If it was set in ppm by the user the error will be displayed in ppm. 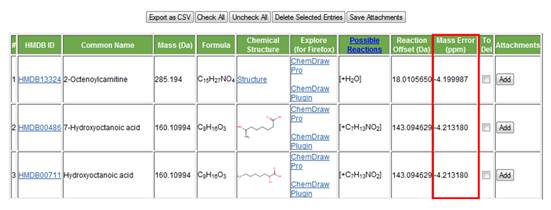
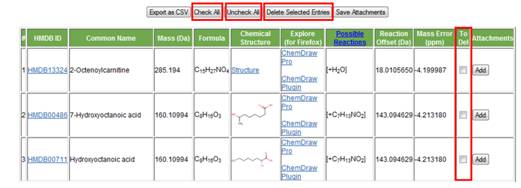
k. To del. This column (Figure 21) is used to delete a particular row or hit. If the user finds a hit not likely to be a compound candidate, check the box and click the "Delete Selected Entries" button to delete this hit. There is also an option of selecting all the hits by click the "Check All" button and then de-selecting one or more hits from the "To Del" column to keep the hit(s) of interest; clicking the "Delete Selected Entries" button will delete all hits except the de-selected ones. The "Unchecked All" button allows the user to de-select all the hits previously selected for deleting.
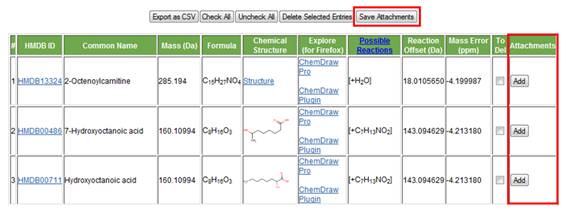
Figure 21. The delete function buttons are highlighted. l. Attachments. This feature allows the user to create a folder (in the user's destination of choice) where all metadata related to a metabolite of interest can be saved (Figure 22). This includes, but is not limited to, experimental MS and MS/MS information, fragmentation information from ChemDraw, all created .csv files, etc.
7. Arriving at a putative metabolite ID. MyCompoundID will aid the user to obtain a putative metabolite identification by using all compiled data as evidence. However, in order to obtain a definitive chemical identification of the metabolite of interest, comparison to a chemical standard should be carried out.
8. Saving metadata in an "evidence folder". Experimental data, ChemDraw fragmentation results and .csv files corresponding to a particular compound can be saved in a folder created using MyCompoundID which can be used as supporting evidence when claiming the putative identification of a metabolite of interest. |
||||||||||||||||||||||||||||||||||||||||||||||||||||||||||||||||||||||||||||||||||||||