|
|
|
Download
PDF
Example of Using MyCompoundID
The
following describes how to use MyCompoundID using the metabolite
3- hydroxyoctanoylcarnitine as an example.
- The user has to enter the desired search parameters
described in the MyCompoundID Tutorial. In this particular case,
one reaction was selected, the ion type selected was [M+H]+, the
m/z ratio entered (Query Mass) was 304.210568 and
finally, the mass tolerance was set to 5 ppm. Please refer to
Figure 1.
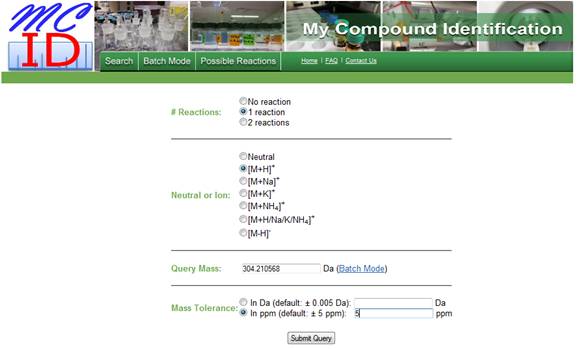
Figure 1. Software interface showing the
entered parameters.
- Once the query is submitted the following page is
displayed (Figure 2). For this particular search, there were
eight possible hits or matches. The user can then open the
structure of any of the possible hits on ChemDraw and use the
Fragmentation Tools in ChemDraw to compare the predicted
fragments with those observed in an acquired experimental MS/MS
spectrum of the query ion. The MS/MS spectrum of
3-hydroxyoctanoylcarnitine acquired on a QTRAP instrument is
shown in Figure 3.
Figure 2. Parameters and results table displaying a total of
eight possible hits.
Figure 3. Experimental MS/MS spectrum of
3-hydroxyoctanoylcarnitine found in urine.
- The user should examine all the possible hits and decide
which one is the most likely match based on the fragmentation
pattern observed in the experimental MS/MS spectrum. In each row,
the structure of the core compound from the HMDB is shown along
with the added or subtracted group information from the possible
biotransformation reaction of the core compound. When the user
clicks on the ChemDraw link in the row, the structure of the core
compound will be displayed in ChemDraw. Using ChemDraw, the user
can add or remove the group from the core compound structure to
generate a postulated structure with its mass matched with the
Query Mass within the mass tolerance threshold. In this
particular case, hit #4 is 3-hydroxyoctanoic acid with the
addition of C7H13NO2 or carnitine. It is known that carnitine
conjugation occurs via an ester linkage between the
carboxylic acid group of the acid and the OH group of carnitine,
followed by the loss of water. Thus, a postulated structure from
the addition of carnitine to the core structure,
3-hydroxyoctanoic acid, can be drawn in ChemDraw.
- Using ChemDraw, the user can fragment the compound of
interest (e.g., the postulated structure in this example) using
the Fragmentation Tools and compare the predicted fragments to
those found in the experimental MS/MS spectrum. The MyCompoundID
Tutorial contains information on how to use the Fragmentation
Tools available in ChemDraw. Figure 4 shows the fragments that
were assigned, including the peak at m/z 145, which is
characteristic of 3-hydroxycarnitines.
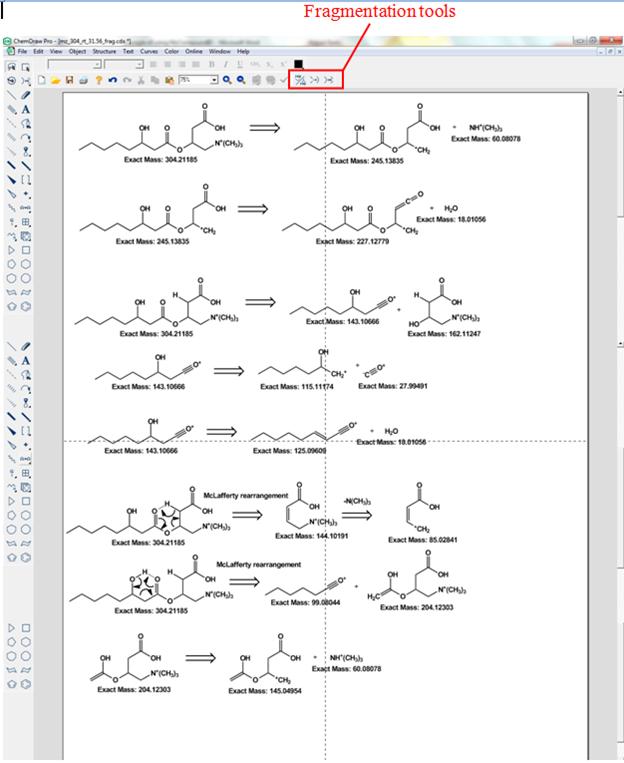
Figure 4. Fragmentation of
3-hydroxyoctanoylcarnitine. The retro synthesis tool was used in
order to display both fragments that originate from bond
cleavages.
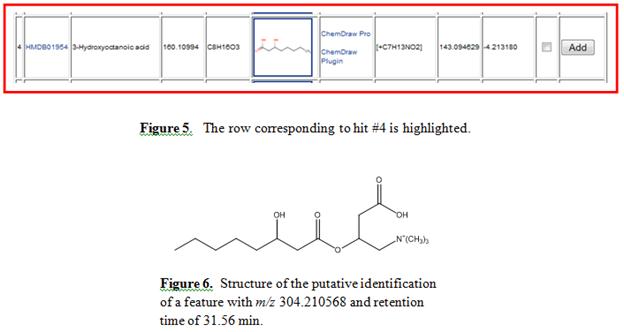
- Based on the fragmentation pattern, the user is able to
select hit # 4 as the most likely match, since the peak at m/z
145 is characteristic of hydroxyacylcarnitines that contain the
OH group in the 3 position. Hit #4 is highlighted in Figure 5
displaying a mass error of 4.2 ppm, which is lower than the mass
tolerance selected. The structure of 3-hydroxyoctanoylcarnitine
is shown in Figure 6.
- Finally the user can save all the files in the same
folder using the save attachment option on the search results
table. This way the user can compile all the evidence supporting
the putative identification(s). Note: The save
attachment function does not work with Internet Explorer; please
use Firefox.
Download
PDF
|